Goal
The goal of this lab was to learn how to download data from the U.S. Census Bureau and transform it into an interactive web map.
Methods
Objective 1: Download 2010 Census Data
On the U.S. Census Bureau website advanced search was used to find the 2010 basic standard census data for Wisconsin counties. After downloading the zip file, the data was unzipped and modified in Microsoft Excel to make it usable in ArcMap.
Objective 2: Download the Shapefile for the WI Census Data
The map tab was opened on the U.S. Census Bureau website and the shapefile was downloaded for use in ArcMap.
Objective 3: Join Data Together
In ArcMap, both the shapfile and the census data table from Excel were opened. The tables for both were joined by a common field, GEO_ID.
Objective 4: Map the Data
Using the symbology tab under properties, a graduated colors map was created of the total 2010 population of WI counties. to be able to map this data, a new field was created and using field calculator the data needed from the joined excel table was inserted into this new field. The new field of population data was then able to be mapped. Labels were adjusted and the number of classes was increased from 5 to 7 to increase clarity.
Objective 5: Map a New Variable
A new variable, the percentage of the population of each country of 20-24 year-olds, was obtained from the Census Bureau. First, a new data frame was create, then using the same steps as before, the data was downloaded, converted to an excel file, modified for use in ArcMap, and then symbolized by a graduated colors map. This variable however was normalized by the total population of each county.
Objective 6: Build a Layout
In layout view, both maps were positioned in a cartographically pleasing way and the necessary map elements were added: title, legends, north arrow, scale, date, source, basemap, and author.
Objective 7: Create a Web Map
Before the web map was created, the basemap and stand-alone table containing the Census Bureau data was deleted because these elements cannot be published. The first step was creating a feature service. Using the service editor, the service was set to a feature service and the item description, summary, and tags were updated. Once this service was published, ArcGIS Online geobrowser was accessed to configure the pop-up window that will accompany the map. Only the County name and population were set to appear in the pop-up window. Title, tags, and a summary was set for the map and the map was then saved on ArcGIS Online.
Results
 |
| Figure 1. Maps of 2010 Wisconsin Total County Population and Percentage of 20-24 Year-Olds. |
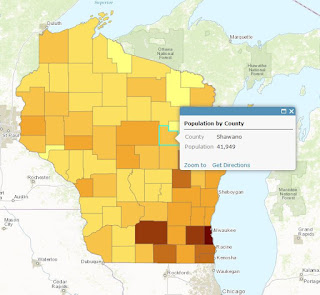 |
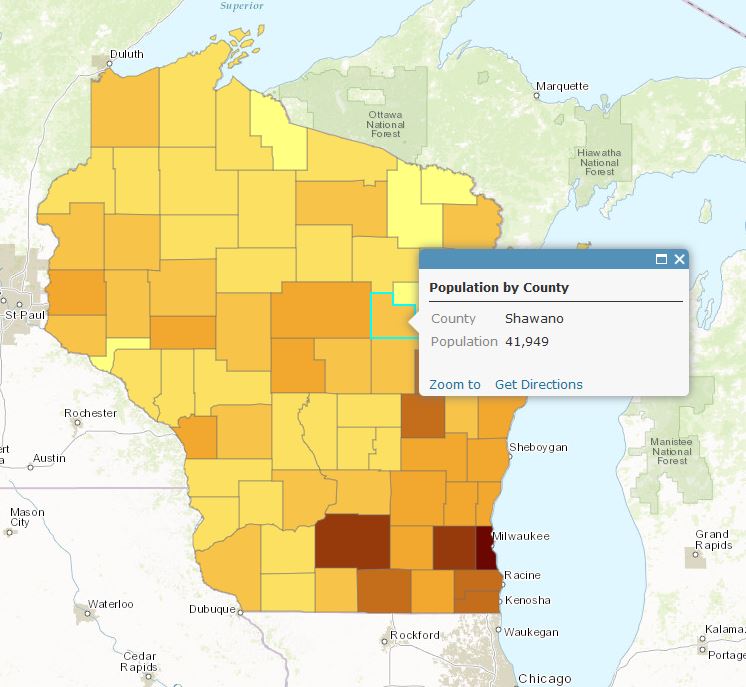
| Figure 2. Interactive Web Map showing 2010 Wisconsin Population Data |
|
|
The map first map of the total county population shows the areas in Wisconsin that have a larger population. These are depicted by the darker colored areas and not surprisingly correspond to the Fox Valley, Madison, and Milwaukee. The second map of the population of the 20-24 year-old bracket shows a spread out distribution across Wisconsin. In the counties with a lower population in map one that have a college, the second map shows a darker coloring corresponding to a higher percentage of the population consisting of the bracket 20-24 years-old. The map would be quite accurate in depicting college locations, but in the highly populated areas colleges are not enough to skew the data towards the 20-24 age bracket. The interactive map on ArcGIS Online can be found
here.
Source
American Fact Finder, U.S. Department of Commerce, 2015. http://factfinder2.census.gov/faces/nav/jsf/pages/searchresults.xhtml?refresh=t . Accessed 6 April 2017.

No comments:
Post a Comment